Though the questions and explanations may come in the normal English or any equivalent first language, mathematics still consists of symbols, abbreviations, variables and mathematical operators, besides the numerous expressions or equations.
Learning and teaching mathematics, thus, become a chore for those "newbies" as well as those who detest the subject.
Graphics to represent mathematics meaning is therefore a welcome move for them. Although not all mathematical expression can be presented in graphics, it is a better option in term of knowledge retention.
Take an example of solving the simultaneous equations.
Example 1:
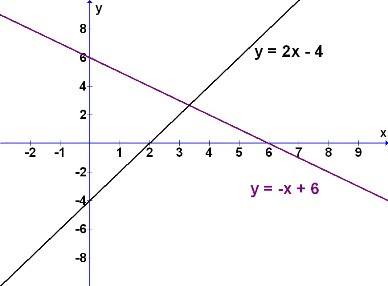
Solve y = 2x - 4 and y = -x + 6
To the mathematics learners, this may seem daunting even after explanation. They may not be able to visualise mentally what really is these 2 equations doing, not to say, solving them.
However, if the question is shown in graphics or converted likewise, the understanding will immediately be clear.
Compare the above "worded" question with the "graphical" question shown below.

From the graphical interpretation of the mathematical question, it is easier then for the students to understand what is needed. The equations are here clearly shown as lines that intersect at a common point. See the advantage now?
Let's see another example.
Example 2:
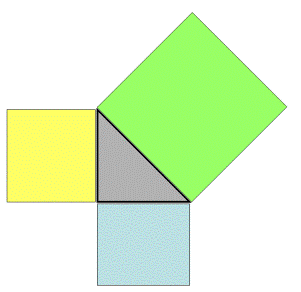
The all-famous Pythagorean Theorem is presented as x2 + y2 = z2.
But this is a simple mathematical expression or formula, and that's all (to them).
What actually does it means? Besides pure memorising, what else?
If this Theorem is presented in the graphical form (below) , you will see the difference.

Here the idea that the "squaring" of the sides are related through the Theorem will be easily accepted. The message of the Pythagorean Theorem as areas of various squares will be captured and locked mentally for understanding and retention with ease.
Why is graphical form a better technique of learning and teaching?
This has to do with our brain. It is well known that our right hemisphere of the brain is for image, and the left hemisphere is for logical matters including studying for mathematics.
This graphical learning and teaching, therefore, goes in line with well-known and accepted method of linking right and left brain for better comprehension.
For mathematics learners, it is hence a merit to be able to convert most mathematical knowledge to images, if possible (although it is understandable that not all is possible).
For mathematics teachers, use graphics if possible to save your breath.
Happy imaging !
.
+copy.jpg)


No comments:
Post a Comment